Creating a graph in Jetpack Compose
The graph does come down in the end!
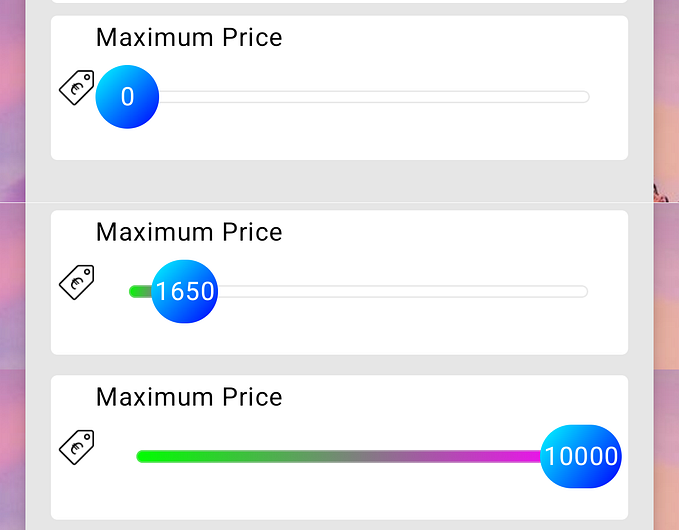
Many times we have to represent some data in form of a progressive graph. That gives users a better experience of its data. So in this article, we’ll explore one of the many ways of creating a graph in Jetpack Compose. Let’s see what will be our end result.

Though the compose API for creating a graph is quite straightforward, there are some minor things that we need to take care of and we also need some understanding of the coordinate system because we’ll be calculating our points to be plotted. Enough talking, let’s dive into the process.
As obvious that we need some custom drawing in this case so we’ll be playing around with Canvas in Compose.
Presumption
Firstly, let's understand how we’ll plot the graph and some assumptions. So we have a X-axis which we assume represents days and Y-axis which represents the number of steps a user has walked on that particular day. We’ll have 10 days on the x-axis and a max of 350 steps in the interval of 50 on the y-axis.
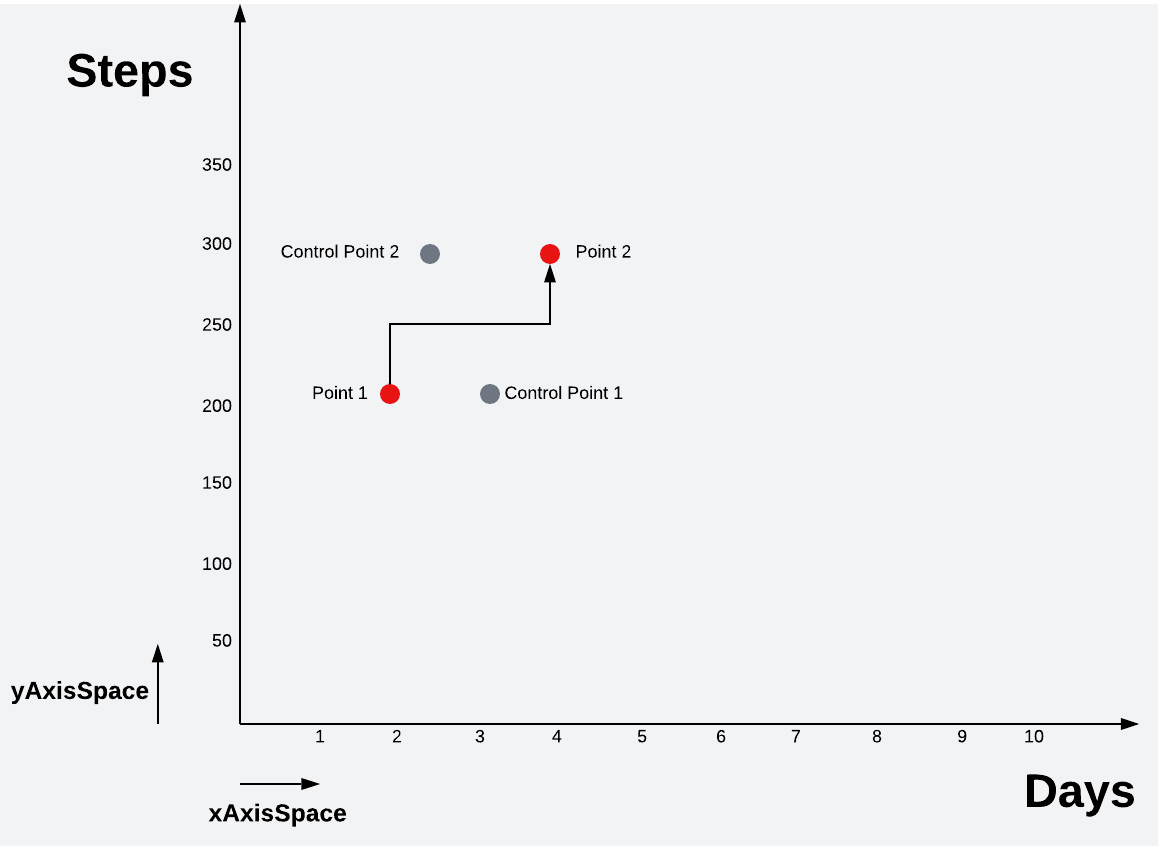
The diagram shows some key terms that we’ll be building the graph over.
xAxisSpace
The minimum or equal spacing provided for values on X axis.
yAxisSpace
The minimum or equal spacing provided for values on Y axis.
Point 1
The first starting point on the graph.
Point 2
The second point on the graph and Point 3.. and so on.
Control point 1 and 2
This is the point with the help of which the bézier curve draws its curve from Points 1 and 2.
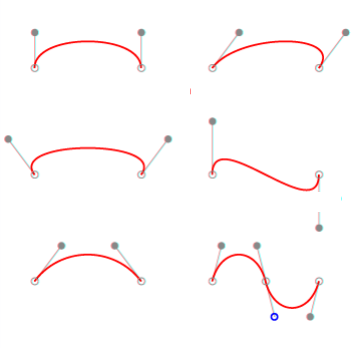
If you’re not aware of how bezier curve works then let’s take a quick look.

As shown in the image, bezier curve has a start (P0) and end (P3) point between which the curve is drawn. It also has two control points P1 and P2 which helps in controlling the shape of the curve. For example, if you’ll change both the control points for various values then some of the shapes could be.
So far, we’ve understood all the minor details that we needed to. Now let’s code what we’ve just seen.
First, let’s create a Graph composable with the following inputs
@Composable
fun Graph(
    modifier : Modifier,
    xValues: List<Int>,
    yValues: List<Int>,
    points: List<Float>,
    paddingSpace: Dp,
    verticalStep: Int
)
The values are self-explanatory. Let’s move to the second step. Now we’ll have a box and inside it, we’ll add a canvas.
Box(
modifier = modifier
.background(Color.White)
.padding(horizontal = 8.dp, vertical = 12.dp),
contentAlignment = Center
) {
Canvas(
modifier = Modifier.fillMaxSize(),
) { }
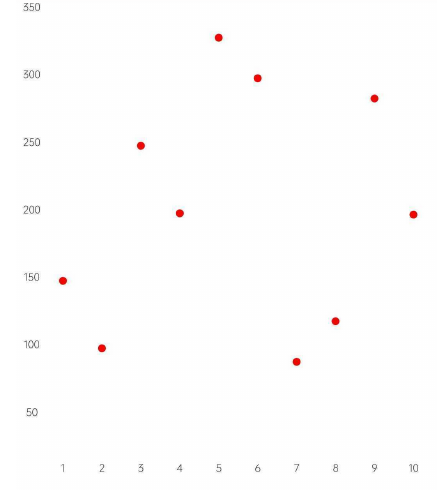
}We set the canvas to the full size of the box and the size of the box we’ll control from the parent. Now we’ll first display our x & y-axis. We’ll also calculate the spacing between points on the x and y-axis by subtracting the padding we provided to our box and dividing by the total points on the axis. We also draw small circles on the points(coordinates) so that we can see where our points are located.
Running the app till here will give us the below output.
Great! We’re getting there. Now to join these points using bezier curve, we need to identify the control points for each pair of points starting from zero.
So let’s calculate the control points for them.
Now as we have the coordinates, and control points for all pairs, let’s join the coordinates. We first move to the first coordinate and then start joining them.
Running the app till here will give us the below output.
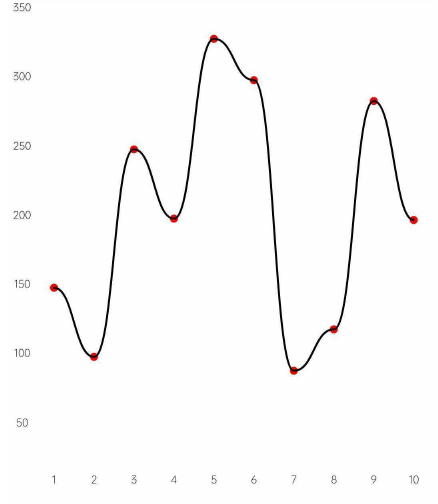
Coool! Isn’t it. Now the final part is to fill the area under the path. For that, we’ll use the recently created path and will extend it to fill the area. The fillPath object will draw a line from the last coordinate of our strokePath to the right bottom corner excluding the vertical space and from there it’ll draw a line to the left side of the graph and then finally to the first coordinate. This ensures a closed loop for our path.
Now if we’ll run the app, we’ll get our graph drawn on screen. See it wasn’t that difficult but only some math and geometry.
Check out the project on github, fork it and try with different values to see variations.
Source Code: https://github.com/aqua30/GraphCompose
That is all for now.
Until next time…
Cheers!